I'm fascinated by cellular automata, and especially “Turmites”1. They are small, simple algorithms that create very interesting results that are often visually appealing for the complex and life-like patterns they generate.
They are so simple that even a kid could easily implement them in real life.
The idea is you have a grid with squares that can take a color from a predefined palette. Let’s say 3 colors for example, red, green, blue.
You start from one square and based on its color, you replace it with an other, you turn left or right and move to the next square, and repeat.
So the rules are something like this:
| if the square is | paint it | and turn |
|---|---|---|
| red | blue | left |
| blue | green | right |
| green | red | righ |
We can call this an LRR turmite, because it’s left, right, right.

The result can be boring (if you have LLL, you will get a small square, as the “ant” just turns around in the same 4 squares forever), but in other cases you get results like this, that may remind you of an ant colony (that’s why they are called Lamgton’s ants, or Turmites, a combination of “Turing machine” and “termite”.)
But today, I’ll focus on turmites that do not generate interesting patterns, and surprisingly, this may be even more interesting.
(I’m an amateur explorer here, what I’ll describe is probably known to mathematicians, but nevertheless I find it very interesting.)
So, some turmites (like LLL) generate boring results, some generate interesting patterns, and some, generate “random” (???) ones.
Before we move on, let’s talk about entropy.
In information theory, entropy measures uncertainty in a probability distribution: Higher entropy means less predictable outcomes, lower entropy more predictable outcomes.
It’s easy to think about image entropy. If I tell you I have a 100x100 image which is totally black, then entropy is zero: you can pick any pixel and know in advance what color it will be. If I tell you I have a photo of the a greenfield that extends to the horizon, the entropy is higher but you still know that any pixel at the top of the image will probably be a shade of blue and any pixel at the lower parts of the image will probably be green.
There are many ways to measure the entropy of an image. One is how well you can guess the color of a random pixel. An other one is how well you can guess the color of a random pixel, if you know the color of a pixel next to it.
For example, if you take a drone photo of a parking full of cars, once you know the color of one pixel, there is a very high probability that the adjacent pixels will have the same color. Again, the entropy is low.
But if you take a cup of white sugar and a cup of brown sugar, mix them and spread them on a surface, and take a photo, the probability of guessing the color of any pixel is 50%. This is an image with very high entropy, what we often call “noise”.
There are more methods and ways to measure an image’s entropy, but a) I’m no expert and b) this is not a course on entropy :-)
What I’m going to use in the examples bellow, is
- Shannon entropy: a number that shows the average “surprise” when examining a pixel. If your image uses N colors, noise would have Shannon entropy equal to log2(N). The higher the number, the more “randomness” in the photo. Our photo of white/brown sugar would have Shannon entropy close to log2(2) = 1. A black photo will have Shannon entropy 0.
- MI-horizontal: Horizontal mutual information. A number that tells us how probable it is to guess a pixel on the left or the right of a given pixel. For example, an image of horizontal stripes has MI-horizontal = 1, because we can tell with absolute certainty the color of a pixel if we know it’s left or right pixel. Values close to zero show higher entropy.
- MI-vertical: Similar to MI-horizontal but for the pixels above and bellow a known pixel.
- MI 4-neighbor: similar, to the above, but for the four (top, bottom, left, right) pixels.
- MI 8-neighbor: same as above, but including the diagonal adjacent pixels.
So, let’s get back to our turmites 2.
For the LRR turmite we saw above (128x64, 3-color turmite) we get these values. I included the values of a similar image generated using Golang’s math/rand

| Shannon | MI-h | MI-v | MI 4-neighbor | MI 8-neighbor | |
|---|---|---|---|---|---|
| LRR | 1.576863 | 0.011126 | 0.011870 | 0.011498 | 0.008027 |
| rand | 1.584952 | 0.000412 | 0.000259 | 0.000335 | 0.000278 |
As you see, while Shanon entropy is similar (“perfect” entropy would get us ~1.5849625 in this case), the rest measurements of entropy show that the LRR image is not that random. And to be honest, if you squint, you can see some patterns that may not be well-defined, geometric patterns, but they are there.
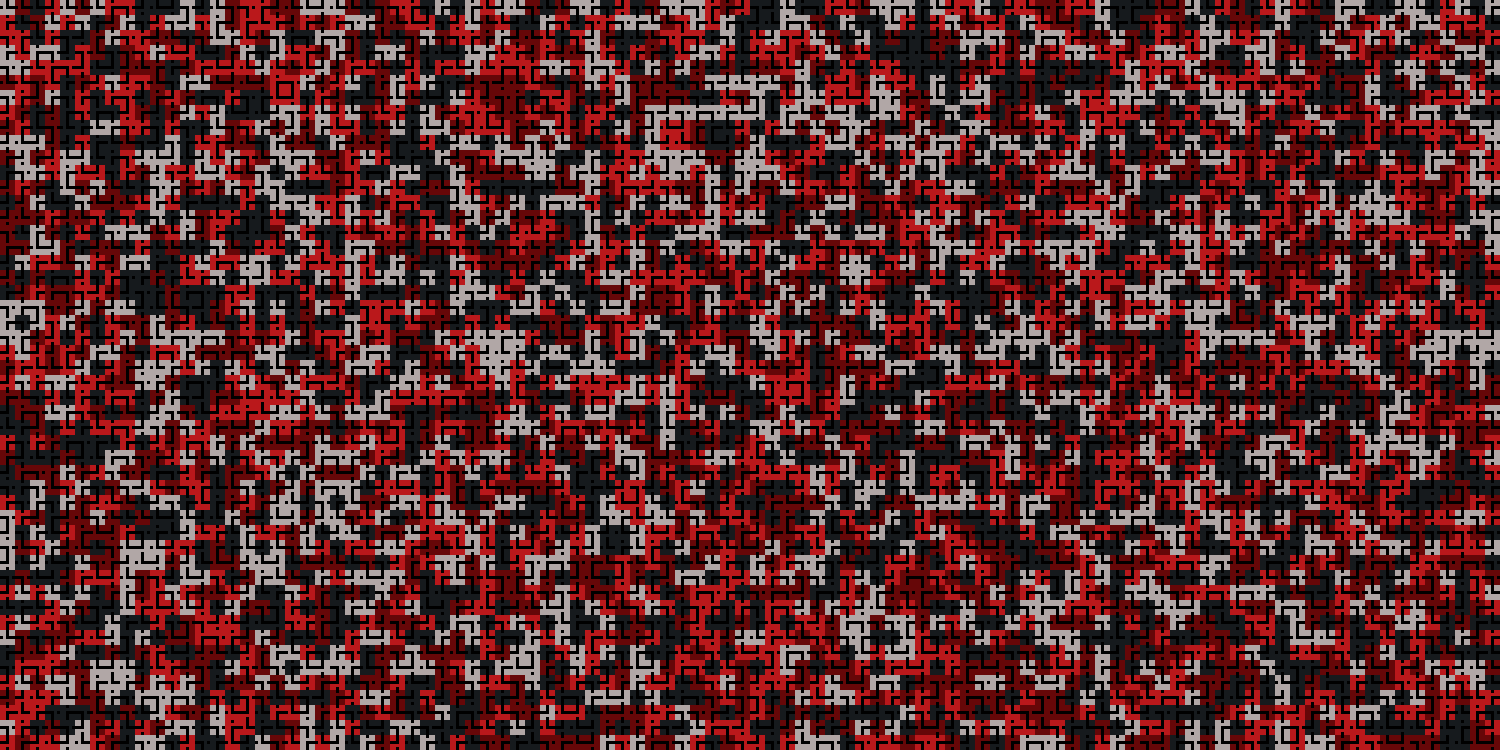
But let’s see an other one: a 4-color LLLR turmite on a 96x54 grid, after 200,000 iterations.

This looks like it has much more entropy than the previous one. Let’s measure it.
| Shannon | MI-h | MI-v | MI 4-neighbor | MI 8-neighbor | |
|---|---|---|---|---|---|
| LLLR | 1.999576 | 0.000515 | 0.000547 | 0.000531 | 0.001024 |
Shannon entropy = 2 for perfect entropy in this case, so we're very close, and the rest of the numbers show a very high entropy! But we know that this is an image generated by an extremely simple algorithm, how can it look like random noise?
Let’s use math/rand again. And to be sure, let’s create 100 random images of the same size, with 4 colors and measure the average. And let’s do the same with crypto/rand that is supposed to have even higher entropy (I think).
| Shannon | MI-h | MI-v | MI 4-neighbor | MI 8-neighbor | |
|---|---|---|---|---|---|
| LLLR | 1.999576 | 0.000515 | 0.000547 | 0.000531 | 0.001024 |
| math/rand | 1.999581 | 0.001167 | 0.001352 | 0.001259 | 0.001290 |
| crypto/rand | 1.999600 | 0.001158 | 0.001309 | 0.001233 | 0.001277 |
Wait.
So, according to these numbers, a 100% predictable3 image, appears to have higher entropy than randomly generated images.
I find this fascinating.
Like I said, I’m just an amateur. So, there may be some other way to measure entropy that shows that the LLLR image has lower entropy than I think.
Or maybe it’s an illustration of how math/rand is not as unpredictable as most people think.
Or maybe it’s a nice visualization of Silvio Micali’s work on Pseudorandomness4.
I would love to hear from people who have better and deeper understanding of the topic5!
-
Visit turmites.art! ↩
-
Usually, turmites are drawn on an infinite plain. In my case, I use fixed-size toroid surfaces, where the leftmost pixels are adjacent to the rightmost and the top row is adjacent to the bottom row. ↩
-
Full video of the process: https://www.youtube.com/watch?v=gpXDUTZLlHM ↩
-
Is true randomness possible? | Silvio Micali and Lex Fridman ↩
-
Original LLLR image (the one displayed in the article is scaled up for visibility), for anyone who wants to do entropy analysis. ↩